
How Does Your City’s ParkScore® Rating Stack Up?
We ranked the 100 most populous U.S. cities by comparing five park categories: equity, access, investment, amenities, and acreage. Is yours at the top?
-
 99%residents live near a park
 -
24%city land is used for parks
-
$345per capita park spending
-
697parks and greenspaces


Don’t see your city?
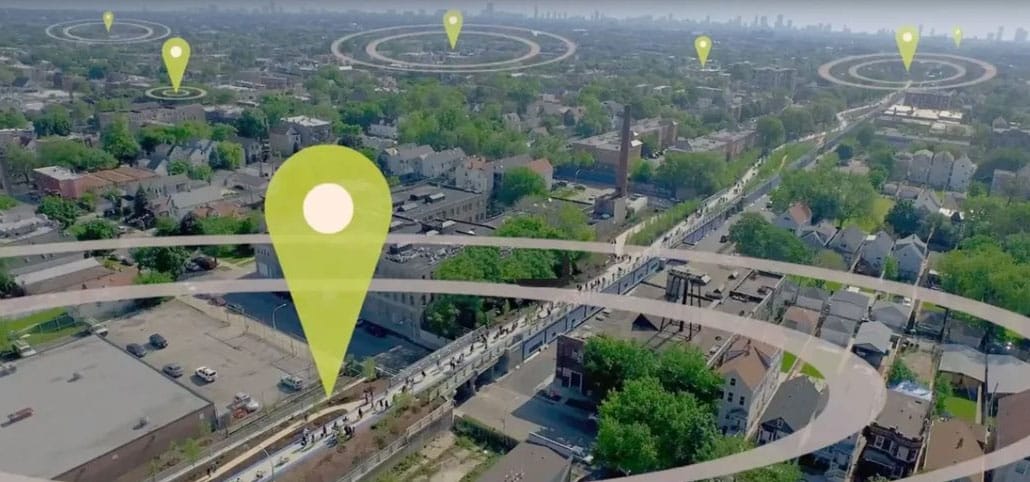
Our ParkScore Index ranks the 100 most populous U.S. cities, but our data goes deeper. Our ParkServe database reveals park access levels for every urban city and town across the United States and Puerto Rico. This powerful tool provides communities with the information they need to help close the park equity gap.


Residents in cities with high ParkScore® rankings are, on average, more socially connected to and engaged in their communities than people in lower-ranking cities. At a time when our country is experiencing high rates of loneliness and isolation, find out how innovative parks departments are creating programs that break down walls and build bridges between neighbors.

Our ParkScore® index is the national gold-standard comparison of park systems across the 100 most populous cities in the United States. Every year, Trust for Public Land publishes the most complete and in-depth look at U.S. city parks systems – explore the complete rankings and resources.

Parks are essential for public health, climate resilience, and strong connected communities. Yet, in the U.S., about 1 in 3 people, including 28 million children, don’t have access to a park within a 10-minute walk of home. We’re working to change that, and we need your support. Help us connect everyone to the outdoors.
We’re Partnering With Mayors to Bring More Parks to Your Community
We’re working with mayors nationwide to bring quality parks and green spaces to everyone, everywhere, with our 10-Minute Walk®program. And mayors across the country are pledging to bring everyone in their community a park within a 10-minute walk of home by 2050.