Columbus, OH

56
How we calculate the Columbus ParkScore® Ranking

The ranking for Columbus is based on how it compares nationally on five characteristics of an excellent park system: access, investment, acreage, amenities, and equity.

Download Columbus’s ParkScore Report

Explore the Custom Rank Application

See Methodology

Access
55 pts
Acreage
59 pts
Investment
38 pts
Amenities
39 pts
Equity
58 pts
71% of Columbus residents live within a 10-minute walk of a park.
Median City, 100 most populous U.S. cities: 74%
Median City, all urban cities and towns in U.S.: 55%

We’re working to ensure that every person, in every neighborhood, in every city across America has a quality park within a 10-minute walk of home.

Columbus residents who live within a 10-minute walk of a park
By Age (%)
Children (0 - 19)
71
Adults (20 - 64)
70
Seniors (65+)
72
By Income (%)
High Income
68
Middle Income
70
Low Income
73
By Race/Ethnicity (%)
Native American*
74
Asian*
62
Black*
73
Hispanic
69
Pacific Islander*
74
White*
71
2 or More Races*
72
Other*
72
*Excludes those that report Hispanic origin (which is captured separately from race by the U.S. Census).
Comparing amount of park space between neighborhoods by race/ethnicity
Residents in neighborhoods of color* have access to 5% more park space per person than the city’s average neighborhood and 15% more than those in white neighborhoods. Additionally, we compared park space in the city’s average neighborhood with others by specific race and ethnicity:
*Neighborhoods of color are defined as those in Columbus with the highest concentrations of people who identify as Black, Hispanic, Indigenous and Native American, Asian American, Pacific Islander, multiple races, or other communities of color (more information).
Comparing amount of park space between neighborhoods by income
Residents in low-income neighborhoods have access to 23% less park space per person than those in the average Columbus neighborhood and 26% less than those in high-income neighborhoods.
8% of Columbus’s land is used for parks and recreation.
National median 15%
How do park amenities measure up?
These six amenities reflect activities popular among a diverse selection of user groups (kids, teenagers, adults, seniors). For each amenity, Columbus is awarded points based on their abundance relative to the other 99 cities.
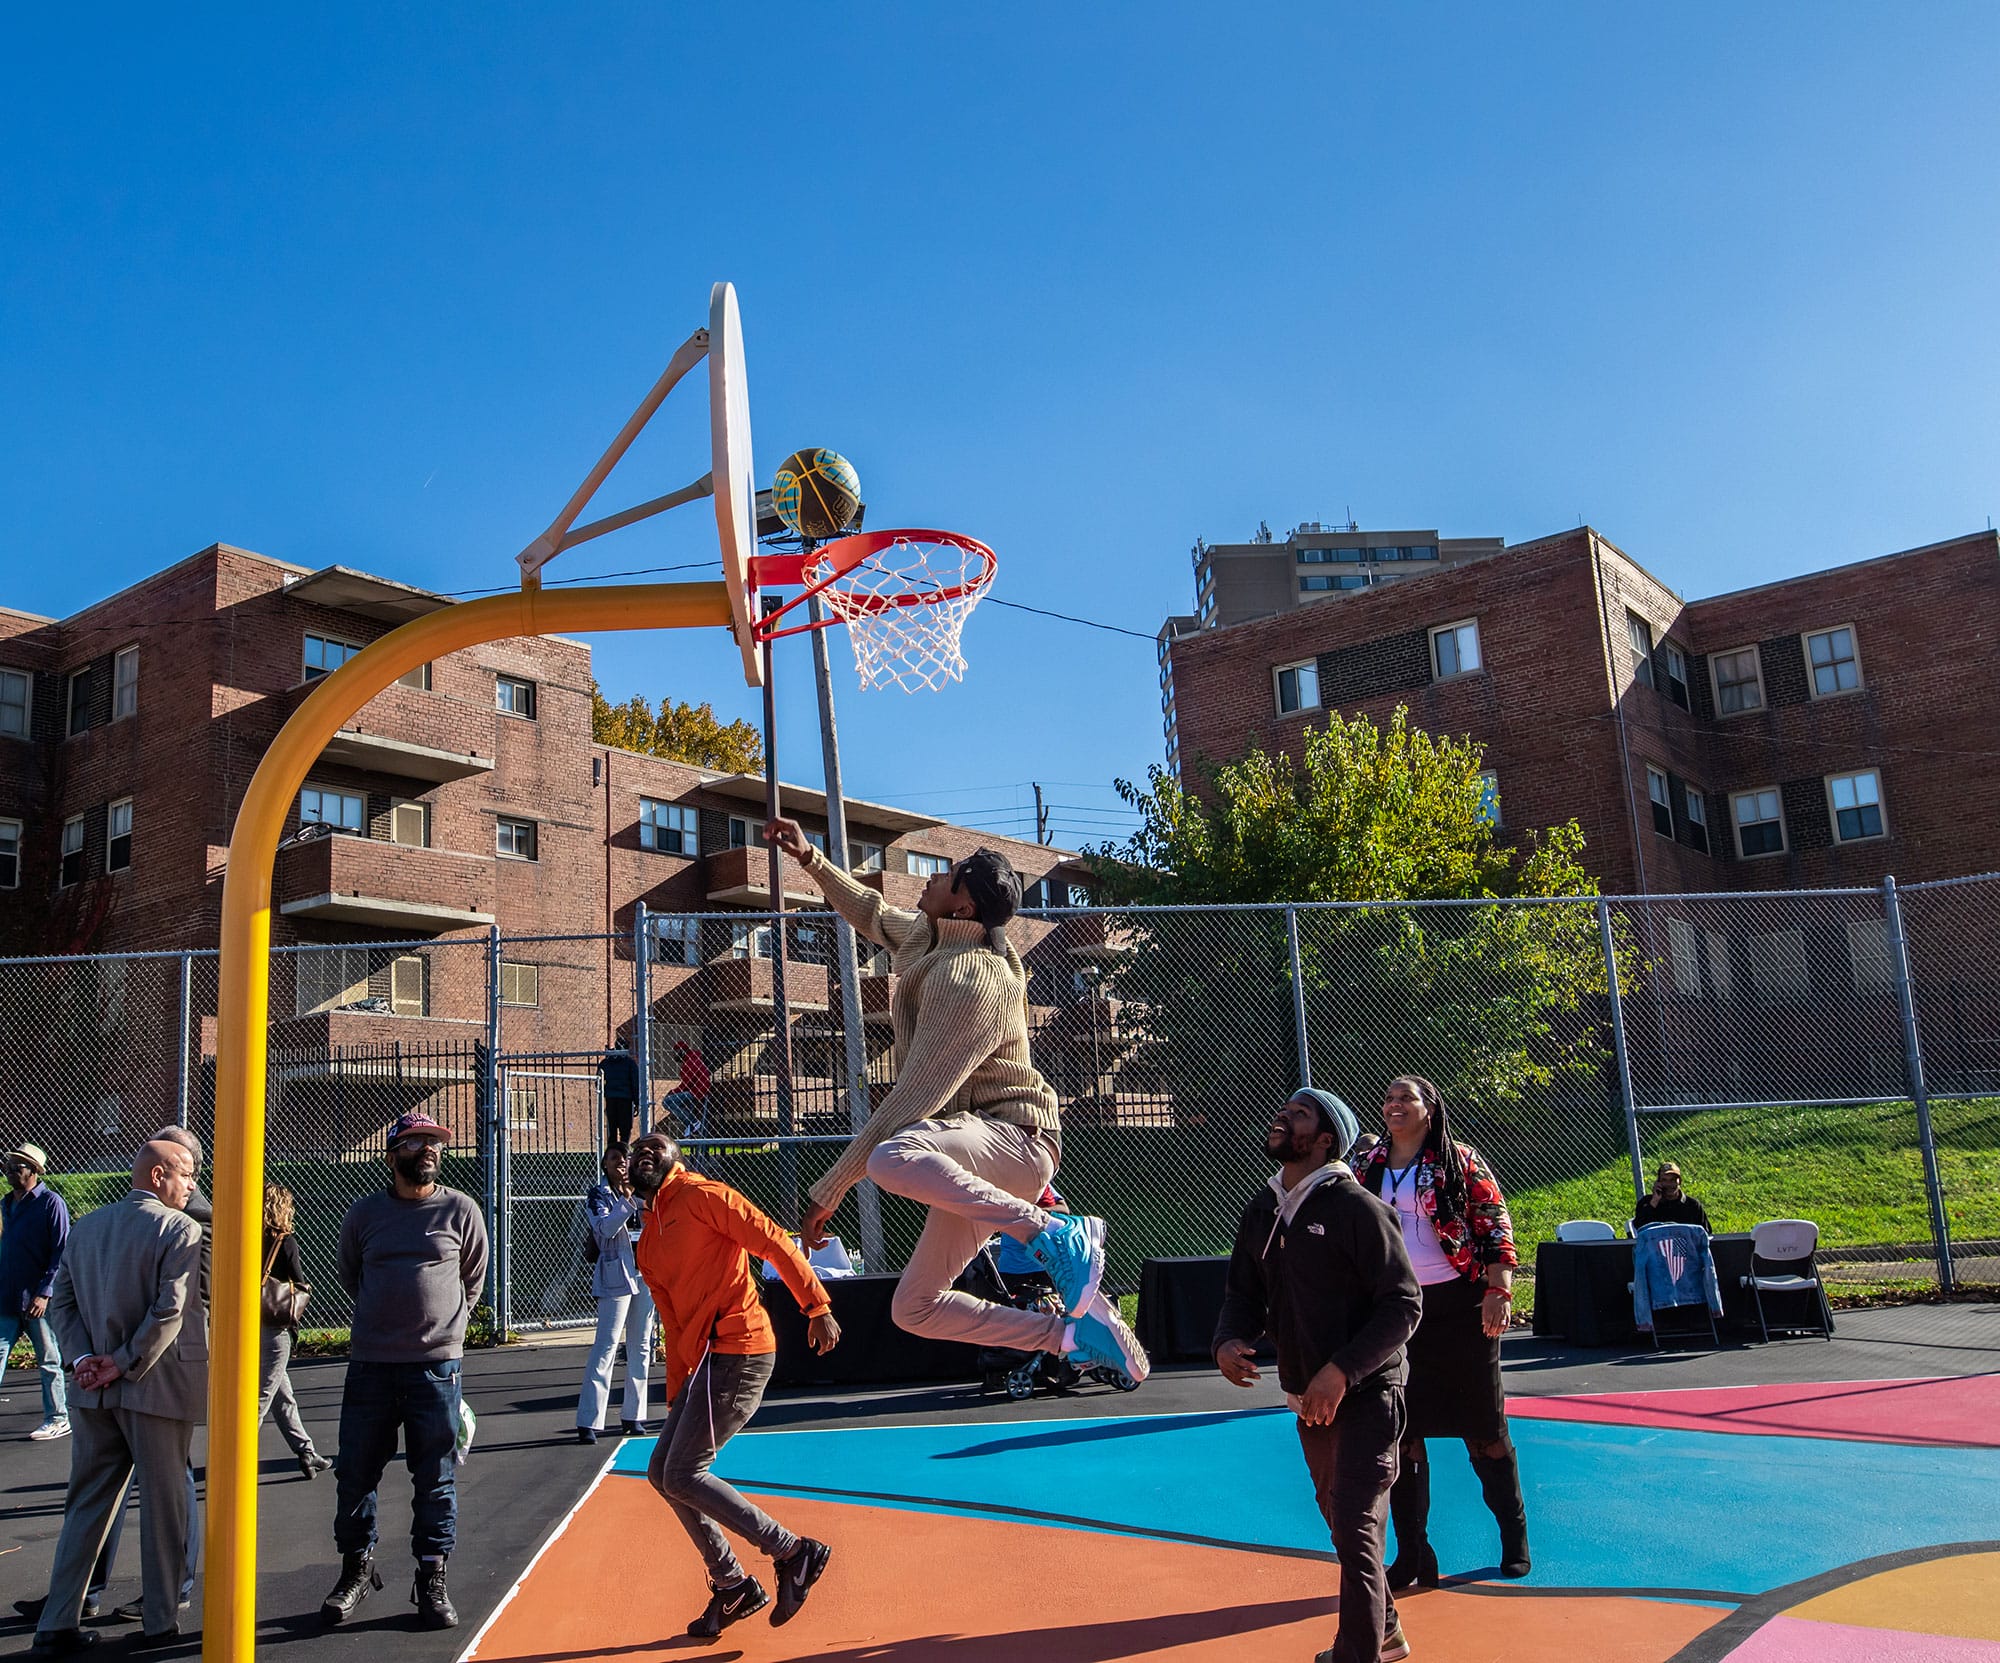
Basketball Hoops
81/100pts
6.4 per 10,000 people
Playgrounds
37/100pts
2.7 per 10,000 people
Rec & Senior Centers
34/100pts
0.6 per 20,000 people
Dog Parks
22/100pts
0.8 per 100,000 people
Bathrooms
31/100pts
1 per 10,000 people
Splashpads
26/100pts
0.8 per 100,000 people
How much is Columbus investing in parks?
We compared Columbus with the other 100 most populous cities in the nation on total park investment per person, aggregating all public and private spending for any publicly accessible park in the city.
Park Investment (Three-Year Average)
  • City agency
    $90 (92%)
  • Other public agencies
    $4.97 (5%)
  • Private organizations
    $0 (%)
  • Monetized volunteer hours
    $3.34 (3%)
$98
Total Spending Per Capita
  • National benchmark: Relative park spending by organization type
  • Average among 100 most populous cities
  • City agency: 85.5%
  • Other public agencies: 7%
  • Private organizations: 5.5%
  • Monetized volunteer hours: 2%
  • Total per capita spending: $108 per person
Make the Commitment
Pledge to make parks a priority!
Everyone should have access to a quality park within a 10-minute walk of home. Our 10-Minute Walk™ Program calls on mayors to demonstrate their commitment to parks and adopt long-term, system-wide strategies that accelerate the creation of parks.